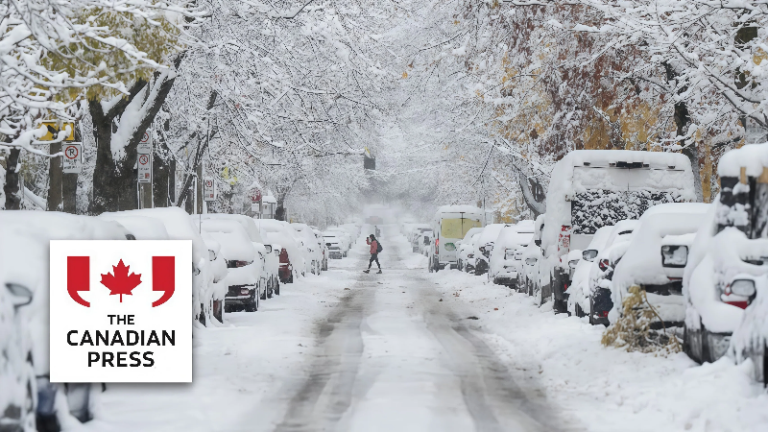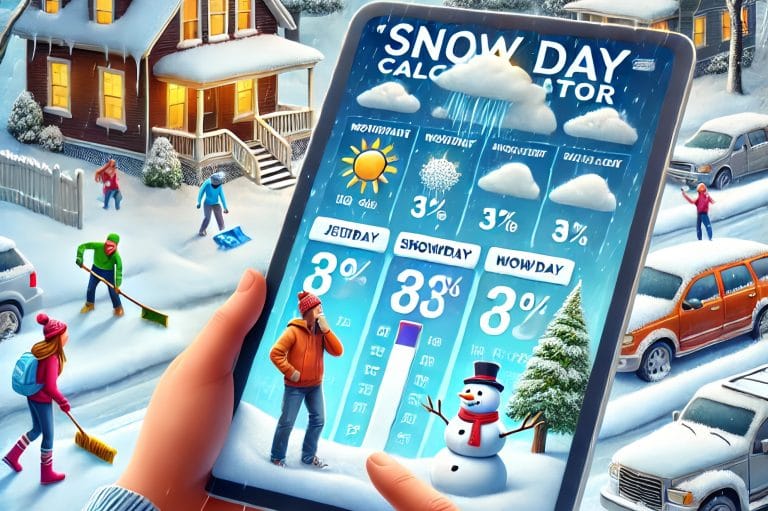
The unpredictability of winter weather presents a perennial challenge for educational institutions, parents, and municipal planners. Snow day calculators have emerged as sophisticated decision-support tools that leverage real-time meteorological data, historical closure patterns, and machine learning to estimate the likelihood of school closures due to inclement weather.
This article explores the underlying methodology, data integrations, and operational considerations that define the state-of-the-art in snow day prediction.
The Evolution of Snow Day Prediction
Historically, school closure decisions were reactive, based on manual assessment of weather forecasts and road conditions. The advent of snow day calculators represents a paradigm shift-moving from subjective judgment to data-driven, probabilistic modeling. These systems now utilize:
- Real-time weather feeds (e.g., The Weather Network, AccuWeather)
- Historical closure data by district and region
- Local infrastructure readiness (e.g., snow removal capacity)
- School board policies and thresholds
This integration allows for granular, location-specific predictions that are both timely and actionable.
Core Algorithmic Components
Data Acquisition
The foundation of any snow day calculator is robust, multi-source data ingestion. Systems typically pull:
- Meteorological variables: precipitation type, accumulation (cm/inches), temperature, wind speed, and timing
- Road condition reports: from municipal and provincial transportation agencies
- School district closure history: frequency, timing, and rationale for past closures
Feature Engineering
Advanced calculators engineer features such as:
- Snowfall rate vs. removal capacity
- Temperature trajectory (e.g., will snow melt by morning?)
- Timing overlap with school commute hours
- Presence of ice or freezing rain (higher closure probability)
Predictive Modeling
Most modern calculators employ ensemble machine learning models-often gradient boosting or random forest classifiers-trained on historical weather and closure data. The model outputs a closure probability (e.g., 78% chance of closure).
Policy Integration
Each school board (TVDSB, DDSB, YRDSB, SCDSB, HWDSB, PDSB, OCSB, WRDSB, HDSB, DSBN, YCDSB) sets unique closure thresholds. Calculators incorporate these policies to ensure predictions are contextually relevant.
Read Also: When Is the Next Snow Day?
User Experience and Operationalization
Input Simplicity
Professional-grade calculators are designed for ease of use-users input a city, postal code, or school district, and the system returns a clear probability and actionable message. For example:
- Input: “Hamilton weather” or “Mississauga weather”
- Output: “82% chance of school closure. Expect announcement by 6:30 AM.”
Real-Time Updates
As weather forecasts evolve, calculators update predictions in real-time, providing the latest actionable insights for parents, administrators, and transportation planners.
Integration with Communication Channels
Advanced platforms push notifications via SMS, email, or school board apps, ensuring stakeholders receive timely updates without manual checking.

Accuracy, Limitations, and Best Practices
Predictive Accuracy
While no tool can guarantee 100% accuracy due to the inherent variability of weather and human decision-making, leading calculators report accuracy rates upwards of 90% in regions with robust data histories. Accuracy is highest when:
- Weather systems are well-modeled (e.g., large, slow-moving storms)
- Closure policies are consistent and transparent
- Real-time data feeds are uninterrupted
Limitations
- Microclimates: Localized weather phenomena (e.g., lake-effect snow) can introduce unpredictability.
- Sudden Policy Changes: Last-minute administrative decisions can override model predictions.
- Infrastructure Variability: Urban vs. rural readiness for snow removal significantly affects closure probability.
Best Practices
- Always cross-reference calculator predictions with official school board announcements.
- Use calculators as part of a broader decision-support process, not as the sole determinant.
- Encourage feedback loops-user reporting of actual closures can improve future model accuracy.
Case Study: Ontario, Canada
Ontario’s diverse geography and decentralized school board system make it an ideal testbed for snow day calculators. Key keywords and their operational relevance:
| Keyword | Operational Relevance |
|---|---|
| Hamilton weather | Localized forecast input for Hamilton schools |
| Mississauga weather | Predictive modeling for Peel District closures |
| Snow day predictor | General tool for probabilistic closure estimation |
| Brampton weather | Input for Brampton-area school boards |
| Sudbury weather | High-variability region; frequent snow events |
| Kitchener weather | Input for Waterloo Region District School Board (WRDSB) |
| Bus cancellations | Output variable; directly tied to predicted closures |
| TVDSB, DDSB, YRDSB | School boards with unique closure policies |
Example Workflow:
A parent in Kitchener inputs “weather Kitchener” into the calculator. The system aggregates Environment Canada forecasts, WRDSB policy thresholds, and recent closure history to output a closure probability and recommended actions.
Read Also: Will There Be a Snow Day Tomorrow? How to Know if You’re Getting the Day Off
Integration with Broader Winter Operations
Snow day calculators are increasingly integrated with municipal and provincial emergency management systems, allowing for coordinated responses across:
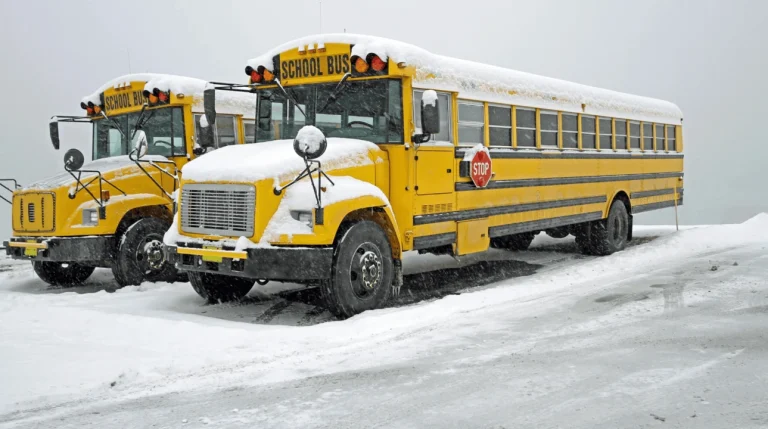
- School transportation (bus cancellations)
- Road maintenance scheduling
- Public safety communications
This systems-level integration ensures that closure decisions are not made in isolation but as part of a holistic response to severe weather.
Future Directions and Innovations
AI and Deep Learning
The next generation of snow day calculators will leverage deep learning for improved pattern recognition, incorporating:
- Satellite imagery analysis
- Hyperlocal weather sensor networks
- Dynamic learning from user feedback
Predictive Analytics for Other Disruptions
The same frameworks used for snow day prediction are being adapted for:
- Heat days
- Flood-related closures
- Air quality events (e.g., wildfire smoke)
Enhanced User Personalization
Future calculators will allow users to set custom thresholds (e.g., for students with special transportation needs) and receive tailored recommendations.
Professional Recommendations
For school administrators, municipal planners, and IT professionals:
- Adopt calculators with transparent algorithms and data sources.
- Integrate calculators with official communication platforms.
- Regularly audit model performance and recalibrate as necessary.
- Solicit user feedback to improve usability and accuracy.
FAQs
Final Thoughts
Snow day calculators represent a leap forward in operational decision-making for educational institutions and families. By synthesizing meteorological, historical, and policy data, these tools provide actionable, real-time insights that enhance safety, planning, and communication.
As predictive technologies evolve, their integration into broader emergency management frameworks will only deepen, offering even greater value to communities facing the challenges of winter weather.